Credit scorecards
Credit Scorecard Scaling: Convert Points to Odds and Probability of Default
Derive a points-to-double-odds scale from a chosen anchor, convert score points to good-to-bad odds and PD, work a synthetic example, and monitor whether the PD mapping remains calibrated.
Updated 2026-11-07
Purpose
Derive a points-to-double-odds scale from a chosen anchor, convert score points to good-to-bad odds and PD, work a synthetic example, and monitor whether the PD mapping remains calibrated.
Key terms
Hover over or focus a term for a quick definition, or open its glossary entry.
Logistic PD = 1 / (1 + exp(−η))
Logit(PD) = ln(PD / (1 − PD)) = η
Good-to-bad odds, O = (1 − PD) / PD = exp(−η)
F = PDO / ln(2)
Score = S₀ + F × ln(O / O₀)
Score = S₀ + PDO × log₂(O / O₀)
Score = (S₀ − F × ln(O₀)) − F × η
O = O₀ × exp((Score − S₀) / F)
Credit Scorecard Scaling: Convert Points to Odds and Probability of Default
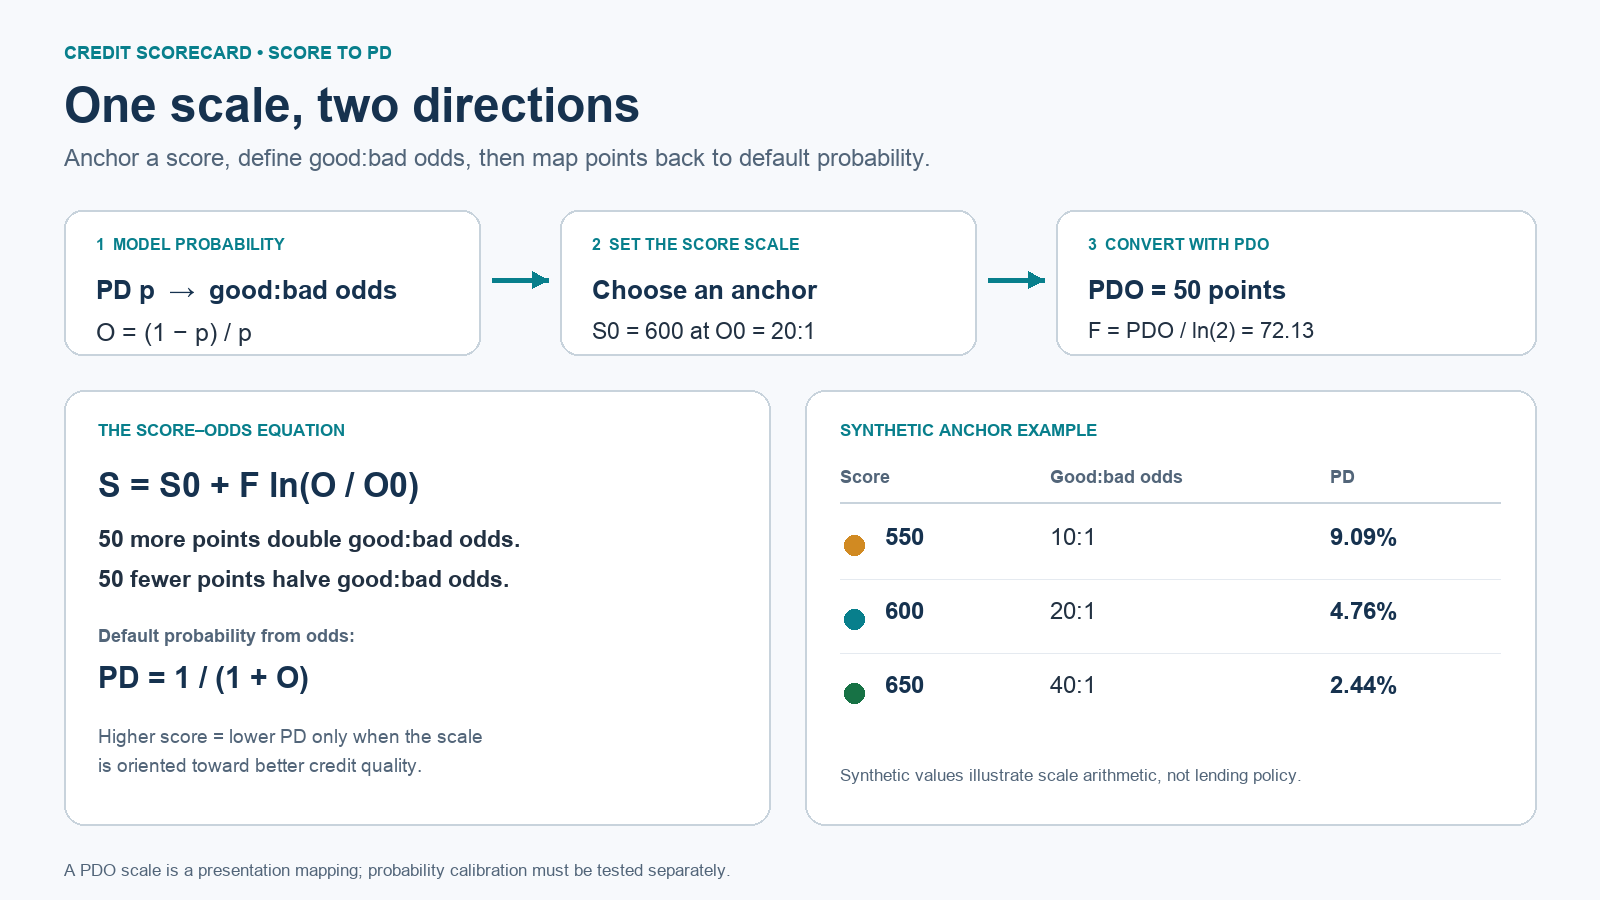
Open the score-to-PD infographic — score anchor, good:bad odds, PDO, and synthetic PD examples.
At a glance
A credit scorecard often turns a logistic regression prediction into points that are easier to sort, explain, and monitor. The score is a rescaled log-odds value. It does not create new predictive information and it does not automatically make the resulting probability of default (PD) calibrated for a new population or horizon.
This guide uses a synthetic convention: higher scores mean lower one-year PD; a score of 600 means good-to-bad odds of 20:1; and 50 points double those odds. The chosen values illustrate the math. They are not a lending standard or risk-policy recommendation.
1. Set the event and odds direction first
Let p be the probability of the event being modeled. For this example, the event is default within a specified one-year performance horizon. The model’s linear predictor is η.
The odds of default are PD divided by the probability of no default. Scorecard conventions often use the reciprocal, good-to-bad odds, so that more points correspond to better credit quality. Always label the event and the numerator in odds. “Odds of 20:1” is ambiguous unless it says good:bad or bad:good.
This sign matters. If a model predicts default probability directly, its logit rises as risk rises. A score designed to increase with credit quality must therefore reverse the sign of that logit when it maps risk into points.
2. Choose an anchor and a points-to-double-odds value
Choose three design values:
Anchor score S₀: the score assigned to a reference odds value.
Anchor good-to-bad odds O₀: the good-to-bad ratio at S₀.
Points to double odds (PDO): how many points multiply the good-to-bad odds by two.
The scale factor converts a natural-log change in odds into score points.
An equivalent form makes the PDO behavior explicit.
For a logistic model whose η is the logit of default, O = exp(−η). The score can also be written as a linear transformation of the model logit.
The constant (S₀ − F × ln(O₀)) is the score offset. The factor F is positive. With this bad-event logit convention, the minus sign makes higher default logit produce a lower score.
3. Convert a score back to odds and PD
Starting from the score equation, solve for odds. Then convert odds to probability.
O = O₀ × 2^((Score − S₀) / PDO)
PD = 1 / (1 + O)
The odds here are good:bad odds. If you instead store bad:good odds, use PD = O / (1 + O) and reverse the score direction. Mixing these two conventions is a common reason a score-to-PD lookup appears inverted.
4. Work through a synthetic scale
Assume S₀ = 600, O₀ = 20:1 good:bad, and PDO = 50. The factor is about 72.13 points per natural-log unit of odds.
F = 50 / ln(2) ≈ 72.13
At the anchor, PD = 1 / (1 + 20) = 4.7619%. Each 50-point increase doubles the good:bad odds; each 50-point decrease halves them.
Score: 500; Good:bad odds: 5:1; One-year PD: 16.67%; Calculation: 20:1 ÷ 4; 1 / (1 + 5)
Score: 550; Good:bad odds: 10:1; One-year PD: 9.09%; Calculation: 20:1 ÷ 2; 1 / (1 + 10)
Score: 600; Good:bad odds: 20:1; One-year PD: 4.76%; Calculation: Anchor; 1 / (1 + 20)
Score: 650; Good:bad odds: 40:1; One-year PD: 2.44%; Calculation: 20:1 × 2; 1 / (1 + 40)
Score: 700; Good:bad odds: 80:1; One-year PD: 1.23%; Calculation: 20:1 × 4; 1 / (1 + 80)
This is a nonlinear relationship between score and PD. A 50-point change doubles or halves odds, not the probability itself. For example, going from 600 to 650 changes PD from about 4.76% to 2.44%; going from 550 to 600 changes it from about 9.09% to 4.76%. The probability-point changes are not identical because PD is a nonlinear transformation of odds.
Check a specific PD against the scale
Suppose a model gives a synthetic one-year PD of 8%. Its good:bad odds are 0.92 / 0.08 = 11.5:1. Convert those odds to points using the chosen anchor:
Score = 600 + 72.13 × ln(11.5 / 20) ≈ 560.1
Convert 560.1 back to odds and PD and the calculation returns approximately 11.5:1 and 8%. This round-trip check catches reversed odds, wrong log bases, and inconsistent anchor settings.
5. Runnable Python
score to odds and PD
This deterministic, one-line example uses Python built-ins only and three synthetic scores. It prints score, good-to-bad odds, and PD, then maps an 8% PD back to a score. It uses no files, network, shell, or system calls.
from math import log; PDO=50.0; S0=600.0; O0=20.0; F=PDO/log(2.0); print([(s, round(O0*2**((s-S0)/PDO),2), round(100/(1+O0*2**((s-S0)/PDO)),2)) for s in (550.0,600.0,650.0)]); p=0.08; print(round(S0+F*log(((1-p)/p)/O0),1))
Expected output: the three score mappings are approximately 550 → 10:1 → 9.09%, 600 → 20:1 → 4.76%, and 650 → 40:1 → 2.44%. The final value is a score near 560.1 for 8% PD.
6. Understand what the points do—and do not—mean
A score is an affine transformation of log odds. The offset moves the score origin; the factor sets the unit size; the anchor defines the score/odds pair. None changes the model’s ranking if applied consistently.
A PDO scale does not by itself establish that a score is a calibrated one-year PD. Calibration asks whether predicted probabilities correspond to observed default frequencies for the relevant population and period. Evaluate calibration on representative, mature outcomes and document the target definition, observation date, horizon, exclusions, and segment. Use out-of-time evidence and investigate intercept shifts, slope changes, drift, and sample size.
A points scale used for internal ranking is not automatically a regulatory capital PD. Under the Basel IRB framework, PD estimation has its own definitions and requirements; for relevant corporate, sovereign, and bank exposures, estimates are based on long-run average one-year default rates and must be supported by data and analysis. A score-to-odds transform does not satisfy those requirements by itself.
For IFRS 9 accounting, a one-year scorecard PD is only an input if the measurement method supports that use. ECL measurement separately requires probability-weighted outcomes, time value of money, and reasonable and supportable information about past events, current conditions, and forecasts. A static score-to-one-year-PD lookup is not a lifetime ECL calculation.
7. Monitor the mapping after deployment
Freeze the scale definition. Version the event class, PD horizon, odds direction, score direction, base score, base odds, PDO, factor, offset, and any rounding rules.
Run anchor tests. Verify that S₀ maps to O₀, S₀ + PDO doubles good:bad odds, and S₀ − PDO halves them. Verify both score-to-PD and PD-to-score calculations.
Compare score bands with mature outcomes. Report account counts, observed defaults, mean predicted PD, observed default rate, and observed-to-expected (O/E) ratio by band and segment. Show uncertainty when default counts are small.
Monitor distribution and calibration separately. Track score distribution or population stability as a mix diagnostic. Track O/E and calibration slope/intercept against mature outcomes as calibration diagnostics. A stable score distribution does not prove calibrated PD, and changing mix does not by itself prove model failure.
Review changes before remapping. If the portfolio, underwriting policy, default definition, data, or time horizon changes, investigate the cause and assess recalibration under model governance. Do not change base odds or PDO silently: that changes score interpretation for every user.
O/E = observed default rate / average predicted PD
For an O/E calculation, use the same population, event, horizon, and weighting on both sides. Keep borrower-weighted and exposure-weighted summaries distinct. A good-to-bad score mapping is a presentation convention; monitoring must still test real outcomes.
8. Common mistakes
Leaving the event direction unstated: tell readers whether the modeled event is default or non-default and label odds as good:bad or bad:good.
Using the wrong sign: with η = logit(default), a higher η should produce a lower score when higher scores mean better quality.
Using base-10 log in one step and natural log in another: the factor F = PDO / ln(2) assumes natural logs. If using log₂ directly, use the PDO form consistently.
Treating a PDO increase as the same PD-point decrease everywhere: PDO doubles odds; the probability change varies along the scale.
Calling the offset or scale a calibration adjustment: the offset and factor set presentation. Calibration is an empirical comparison with observed outcomes.
Interpreting scores outside the validated range as reliable probabilities: odds arithmetic still returns a number, but extrapolation beyond development support may be unreliable.
Confusing internal score scale, IFRS 9 ECL measurement, and regulatory capital PD: each has a different purpose and requirements.
References
U.S. Geological Survey, Statistical Methods in Water Resources, Chapter 15, “Regression for Discrete Responses,” logistic regression odds and logit equations. Used here for the general binary logistic-regression relationships.
Basel Committee on Banking Supervision, Basel Framework CRE36: IRB minimum requirements, including PD estimation requirements. These rules apply to institutions using the relevant Basel IRB framework and local implementation.
IFRS Foundation, IFRS 9 Financial Instruments, paragraph 5.5.17 on expected credit loss measurement.
ScorePlus, Notes on Scorecard Scaling, an industry explanation of PDO scaling. The formulas in this guide are derived directly from the stated anchor and odds-doubling convention.
Educational example only. All figures are synthetic. Actual model development, calibration, approval, accounting, and regulatory treatment require documented methods appropriate to the institution, product, and jurisdiction.
Try a reproducible Python example
These examples use synthetic inputs and run locally in a browser worker. Edit the code, run it, and compare its output with the published example.
Runnable Python · local in your browser
Calculate WOE and IV from grouped counts
Use synthetic good and bad counts for three ordered scorecard bins. The 0.5 adjustment avoids a zero distribution in this small example.
Output
Run the code to see the output.
Runtime loads only after you press Run. Code runs in a separate browser worker with a 10-second limit and a 20,000-character output cap. Use synthetic examples only; browser execution is not a secure environment for secrets or sensitive records.
Educational material only. Methods and examples are simplified; state and validate the assumptions required for your use case.