Credit scorecards
Behavioral Scorecards for Existing Customers: Build, Validate, and Monitor Monthly Risk Scores
A practical guide to behavioral scorecard design for existing accounts: point-in-time data, 12-month outcomes, PD calibration, validation, and monitoring.
Updated 2026-11-13
Purpose
A practical guide to behavioral scorecard design for existing accounts: point-in-time data, 12-month outcomes, PD calibration, validation, and monitoring.
Key terms
Hover over or focus a term for a quick definition, or open its glossary entry.
O/E = observed defaults ÷ expected defaults = 19 ÷ 14 = 1.36Detailed explanation
Summary. A behavioral scorecard reassesses the risk of an existing borrower using information observed after account opening. This guide walks through the data design, outcome window, feature engineering, probability calibration, validation, and ongoing monitoring. All examples are synthetic. A score supports governed credit review; it is not, by itself, a lending decision.
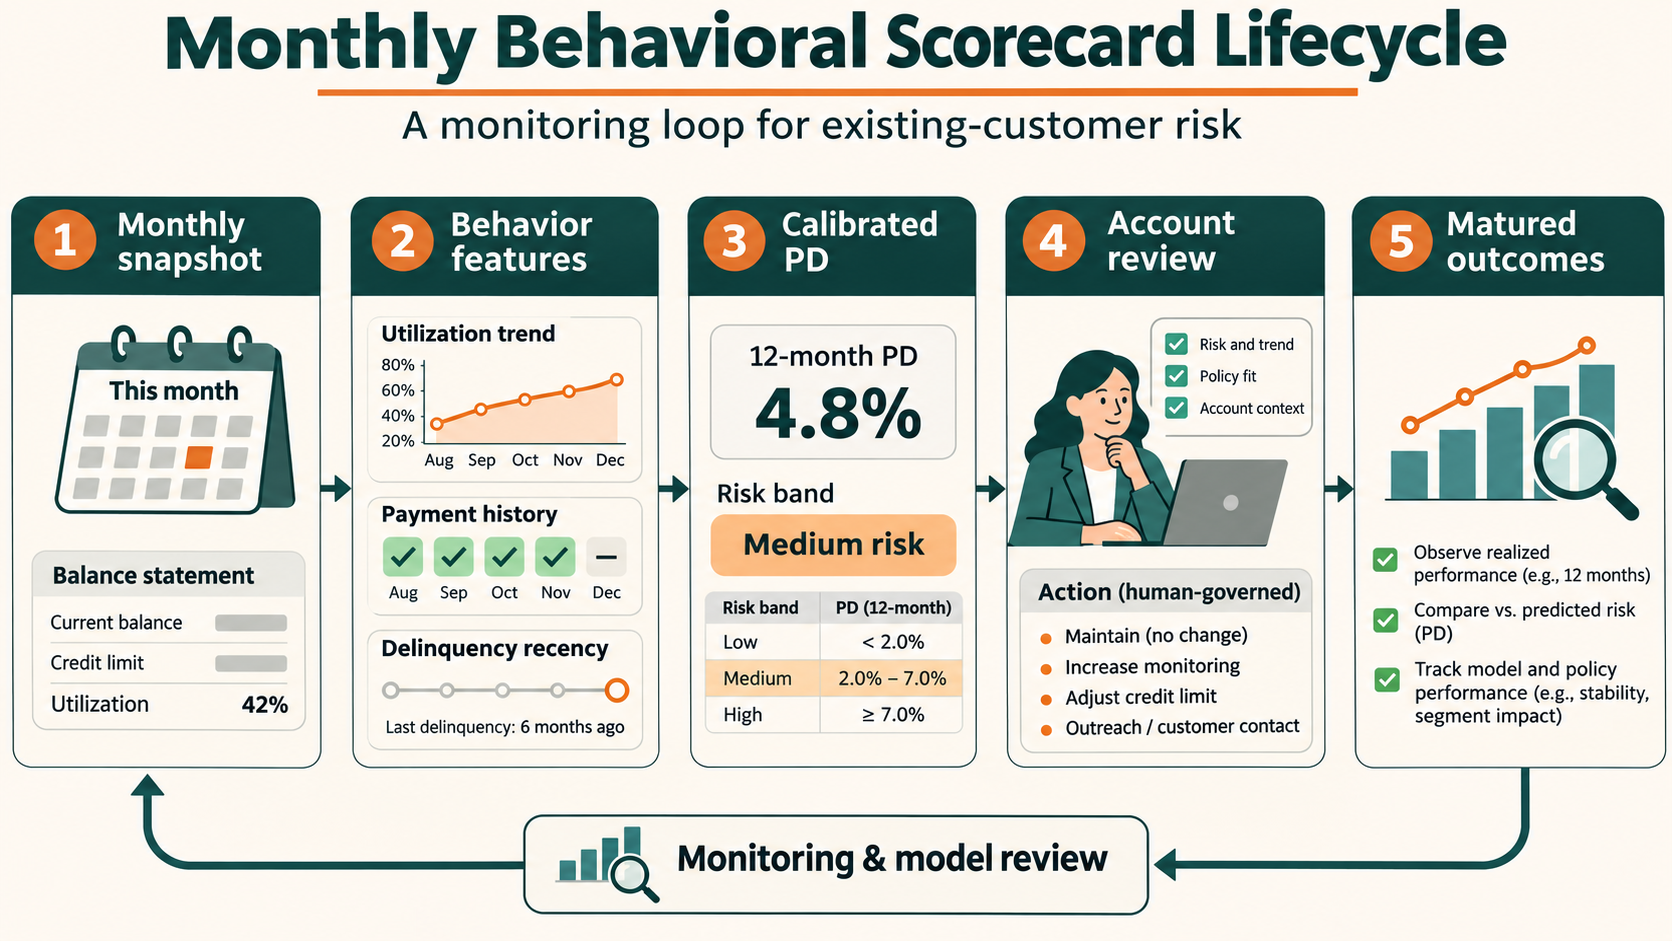
Open the behavioral scorecard workflow infographic
Illustrative workflow: each snapshot is scored using information available at that date; later, matured outcomes are compared with the predictions and feed monitoring and model review.
At a glance
Who is scored? — Practical answer: Existing borrowers or accounts that meet a defined eligibility rule.
When? — Practical answer: At a consistent monthly or quarterly observation date.
What is predicted? — Practical answer: A defined event, such as default within the next 12 months, from information available on the observation date.
What is different from an application score? — Practical answer: A behavioral model uses the account’s subsequent payment and exposure history; an application model uses information collected at origination.
What must be monitored? — Practical answer: Data availability, population and feature drift, score migration, calibration on matured outcomes, discrimination, overrides, and downstream impacts.
1. What a behavioral scorecard measures
A credit scorecard maps borrower or account characteristics to an ordered risk score. A behavioral scorecard applies this idea after origination. It may be refreshed monthly to support early-warning review, account management, limit review, or collections prioritization.
The target must be explicit. For example, this guide uses default within 12 months after the score date. Link the target to the organization’s approved default definition and specify treatment of cures, restructures, closed accounts, fraud, and missing outcomes. A probability of default (PD) is meaningful only with its event definition, population, and time horizon stated.
Timing — Application score: Scored near application or account opening — Behavioral score: Scored after account activity has accumulated
Inputs — Application score: Uses application-time and permitted bureau data — Behavioral score: Uses application information plus permitted, time-stamped account behavior available at scoring time
Common role — Application score: Often supports initial underwriting — Behavioral score: Often supports monitoring and account management; local policy determines permissible use
Outcome window — Application score: Outcomes are measured after application — Behavioral score: Outcomes are measured after each defined behavioral snapshot
The score is not automatically a point-in-time (PIT) PD, a through-the-cycle (TTC) PD, an accounting expected-credit-loss estimate, or a regulatory capital parameter. Match the model’s calibration target to its intended use. EBA PD calibration guidance is scoped to the EU IRB framework; it is a useful source for calibration concepts, not a universal rule for every internal behavioral model.
2. Build the model in nine steps
Step 1 — Define the use and decision boundary
Write down the portfolio, eligible accounts, score frequency, intended users, target horizon, and actions the score may inform. Document which actions require separate policy rules, affordability checks, customer communication, or human review. A model score alone should not silently trigger a consequential action.
Step 2 — Create a point-in-time snapshot
Create one row per eligible account and observation date. Freeze the source data as it was available at that date. Store account/customer identifiers, snapshot timestamp, product, model version, raw score, calibrated PD, input-data version, and eventual outcome. Keep a reproducible audit trail.
Step 3 — Set the event and performance window
For a 12-month target, observe whether the defined default occurs during the 12 months after each snapshot. Ensure outcomes have had the full follow-up period before using them for validation. Accounts with incomplete follow-up are not “non-defaults”; mark them immature or use an approved censoring method. Define how closure, sale, refinancing, cure, re-default, and competing events are handled.
Step 4 — Build features that exist at score time
Useful families include utilization level and trend, payment-to-due ratio, missed-payment count and recency, maximum days past due, balance volatility, cash-advance share, limit changes, and recent exposure growth—only where law, consent, policy, and data quality permit. Use fixed lookback windows and clear denominators. Missing, stale, and not-applicable values should be distinguished.
Step 5 — Prevent leakage and sampling bias
Use only fields available at the snapshot timestamp. Exclude collections actions, charge-off data, or post-default records that reveal the future target. Split development and validation by time; where customers have multiple accounts or snapshots, group or otherwise account for dependence so the same borrower does not create an unrealistically easy test set. Learn imputation, binning, scaling, variable selection, and other preprocessing from training data only. The scikit-learn guidance explains why fitting preprocessing before the split can leak information.
Step 6 — Fit and challenge the ranking model
Choose an interpretable scorecard or another justified model. Check sign and shape of relationships, missingness, stability across products and vintages, and whether the model adds value over a simple baseline. Keep the feature transformations and score mapping versioned. Evaluate discrimination on a later, mature holdout sample; do not select a model solely on training performance.
Step 7 — Calibrate predicted probabilities
The ranking score orders risk; calibration maps scores to event probabilities. Compare average predicted PD with observed outcomes for the same horizon and a representative, mature sample. Review calibration overall and by meaningful risk bands, product, vintage, and other approved segments. Document any adjustment and its rationale. The EBA’s IRB PD guidance describes calibration at grade or pool level in its regulatory context.
Step 8 — Validate before operational use
Review data lineage, target construction, leakage, discrimination, calibration, stability, sensitivity, limitations, and implementation independently of the model build. Test score reproducibility, missing-input behavior, cut-offs, overrides, and fallback rules. Record approval, model owner, effective date, and monitoring triggers.
Step 9 — Put controls around use
Define score refresh timing, permissible use, access controls, exception handling, human review, override logging, customer impact review, escalation owners, and a rollback path. The Basel Committee’s credit-risk principles emphasize ongoing portfolio administration and monitoring; the specific control design must reflect jurisdiction and institution policy.
3. Worked calibration example with synthetic data
Suppose a mature, synthetic validation cohort contains 340 account snapshots. For each snapshot, the model predicts the probability of the defined default event during the next 12 months. The table groups records by risk band. Average PDs and observed counts are illustrative, not recommended thresholds.
Lower — Accounts: 200 — Average predicted 12-month PD: 1.5% — Expected defaults: 3 — Observed defaults: 3 — Observed rate: 1.5% — Observed / expected: 1.00
Watch — Accounts: 100 — Average predicted 12-month PD: 5.0% — Expected defaults: 5 — Observed defaults: 8 — Observed rate: 8.0% — Observed / expected: 1.60
Elevated — Accounts: 40 — Average predicted 12-month PD: 15.0% — Expected defaults: 6 — Observed defaults: 8 — Observed rate: 20.0% — Observed / expected: 1.33
Total — Accounts: 340 — Average predicted 12-month PD: — — Expected defaults: 14 — Observed defaults: 19 — Observed rate: 5.6% — Observed / expected: 1.36
Here the expected defaults are the sum of individual predicted PDs (or, in this simplified table, account count multiplied by average PD). The overall observed-to-expected ratio is:
An O/E above 1 means more defaults occurred than the model predicted in this cohort. The Watch and Elevated bands also show underprediction. Before concluding that the model is defective, check outcome maturity, population mix, default capture, sampling weights, segment definitions, and statistical uncertainty. Counts are small in some bands; show confidence intervals or uncertainty ranges and use approved escalation criteria rather than a universal cutoff.
Repeated monthly observations of the same account are not independent records. For this simple illustration, treat the rows as a single validation cohort with one observation per account. A production analysis with overlapping snapshots should use a design that addresses repeated observations, such as non-overlapping landmark cohorts or an appropriate dependence-aware method.
4. Behavioral feature families
Repayment — Example definition: Amount paid divided by contractual amount due over a fixed lookback — Common checks: Zero due, reversals, partial payments, and due-date changes
Delinquency — Example definition: Maximum days past due (DPD), count of missed payments, or time since last delinquency — Common checks: DPD counting convention, grace periods, payment allocation, cure and re-default rules
Exposure — Example definition: Current balance divided by limit; balance change over 3 or 6 months — Common checks: Limit changes, frozen accounts, utilization above 100%, stale balances
Volatility — Example definition: Variation in balances or payment amounts over a defined window — Common checks: Short histories, outliers, inconsistent statement cycles
Account events — Example definition: Recent restructuring, returned payment, or limit action — Common checks: Availability timestamp, policy feedback, event semantics, permissible use
Data quality — Example definition: Missingness, stale-source age, invalid-value flags — Common checks: Source coverage by time, product, channel, and segment
Define every feature with a timestamp, lookback, denominator, null policy, and version. Do not let a feature silently change meaning when a source system changes.
5. Monitoring framework
Coverage and data — Metrics and views: Eligible/scored counts; missing, stale, invalid, and fallback-input rates — Investigation questions: Did a feed stop? Did a new product or system change the population?
Population and features — Metrics and views: Score/PD distribution; feature distributions; Population Stability Index (PSI) or other fixed-bin drift views — Investigation questions: Are bins and reference periods fixed? Is drift concentrated in a segment?
Migration — Metrics and views: Month-to-month risk-band transition matrix; large score movement; account inflow/outflow — Investigation questions: Is movement due to real behavior, policy actions, or data revisions?
Calibration — Metrics and views: Observed and expected defaults; O/E by band, product, vintage, and time; uncertainty intervals — Investigation questions: Are windows mature and default capture complete? Is underprediction systematic?
Discrimination — Metrics and views: AUC/ROC or another approved ranking metric on matured outcomes — Investigation questions: Has ranking weakened materially relative to the approved baseline?
Use and outcomes — Metrics and views: Override frequency and direction; action rates; exceptions; outcomes after actions — Investigation questions: Is the score used as approved? Are feedback effects changing labels or exposure?
Governance — Metrics and views: Version, approval, change log, open issues, owner and review date — Investigation questions: Are triggers and remediation owners defined and followed?
Set thresholds from portfolio size, model purpose, historical variability, risk appetite, and governance policy. PSI or a single aggregate accuracy metric is not a stand-alone pass/fail decision. Investigate material changes, document the result, and decide whether to recalibrate, restrict use, rebuild, or accept the change with controls.
6. Common failure modes and safeguards
Future information enters a feature. Reconstruct as-of availability and rerun leakage checks.
Immature accounts are counted as good. Use only matured outcomes or a documented censoring method.
Monthly snapshots inflate sample size. Report distinct borrowers and use dependence-aware validation.
Policy actions alter future behavior. Track interventions; interpret post-action outcomes as influenced by treatment, not as untreated model forecasts.
Averages hide segment underprediction. Review calibration by approved, sufficiently sized segments with uncertainty.
A score is mistaken for a decision. Keep policy, human review, customer treatment, and any legal obligations explicit and independently controlled.
Drift metrics are used mechanically. Confirm source changes, population changes, and data validity before changing a model.
7. Keep the measurement purpose clear
Internal account-management risk — Main question: Which accounts may need review under internal policy? — Behavioral scorecard relationship: A behavioral score may be a decision-support input after governance approval.
Accounting expected credit loss — Main question: What are the probability-weighted contractual cash shortfalls under the applicable accounting framework? — Behavioral scorecard relationship: A behavioral PD may inform a component only if consistent with the accounting framework, horizon, scenarios, and measurement design.
Regulatory capital — Main question: What risk parameters and requirements apply under the governing prudential framework? — Behavioral scorecard relationship: An internal score is not automatically an approved regulatory rating system or capital parameter. EBA PD/LGD estimation guidance discussed above is specifically within EU IRB scope.
Do not reuse a PD across these purposes without documenting the target, horizon, conditioning, conservatism, scenario treatment, approval, and applicable rules.
8. Practical release checklist
Freeze a documented score-time population and point-in-time feature set.
Confirm event definition, horizon, outcome maturity, and account/customer linkage.
Check time-based validation and leakage controls.
Report discrimination and calibration with counts, segments, and uncertainty.
Test production parity, missing-data behavior, overrides, access, and fallback.
Approve intended uses, owners, monitoring thresholds, escalation, and rollback.
Reassess performance and customer impact on a scheduled basis and after material changes.
Sources and scope
Basel Committee, Principles for the Management of Credit Risk (2025) — current supervisory principles, including ongoing credit portfolio administration and monitoring.
European Banking Authority, Guidelines on PD estimation, LGD estimation and treatment of defaulted assets (EBA/GL/2017/16) — calibration and data principles in the EU IRB regulatory context; not a universal rule for all internal models.
scikit-learn, Common pitfalls and recommended practices: data leakage — split before fitting preprocessing and keep test information out of model development.
This is an educational methodology guide, not accounting, legal, or regulatory advice. Thresholds and customer actions must be approved for the portfolio and jurisdiction.
Try a reproducible Python example
These examples use synthetic inputs and run locally in a browser worker. Edit the code, run it, and compare its output with the published example.
Runnable Python · local in your browser
Calculate WOE and IV from grouped counts
Use synthetic good and bad counts for three ordered scorecard bins. The 0.5 adjustment avoids a zero distribution in this small example.
Output
Run the code to see the output.
Runtime loads only after you press Run. Code runs in a separate browser worker with a 10-second limit and a 20,000-character output cap. Use synthetic examples only; browser execution is not a secure environment for secrets or sensitive records.
Educational material only. Methods and examples are simplified; state and validate the assumptions required for your use case.