Probability of default (PD)
Transition matrices and rating migration
Use rating migration to describe movement and derive horizon risk only under explicit assumptions.
Purpose
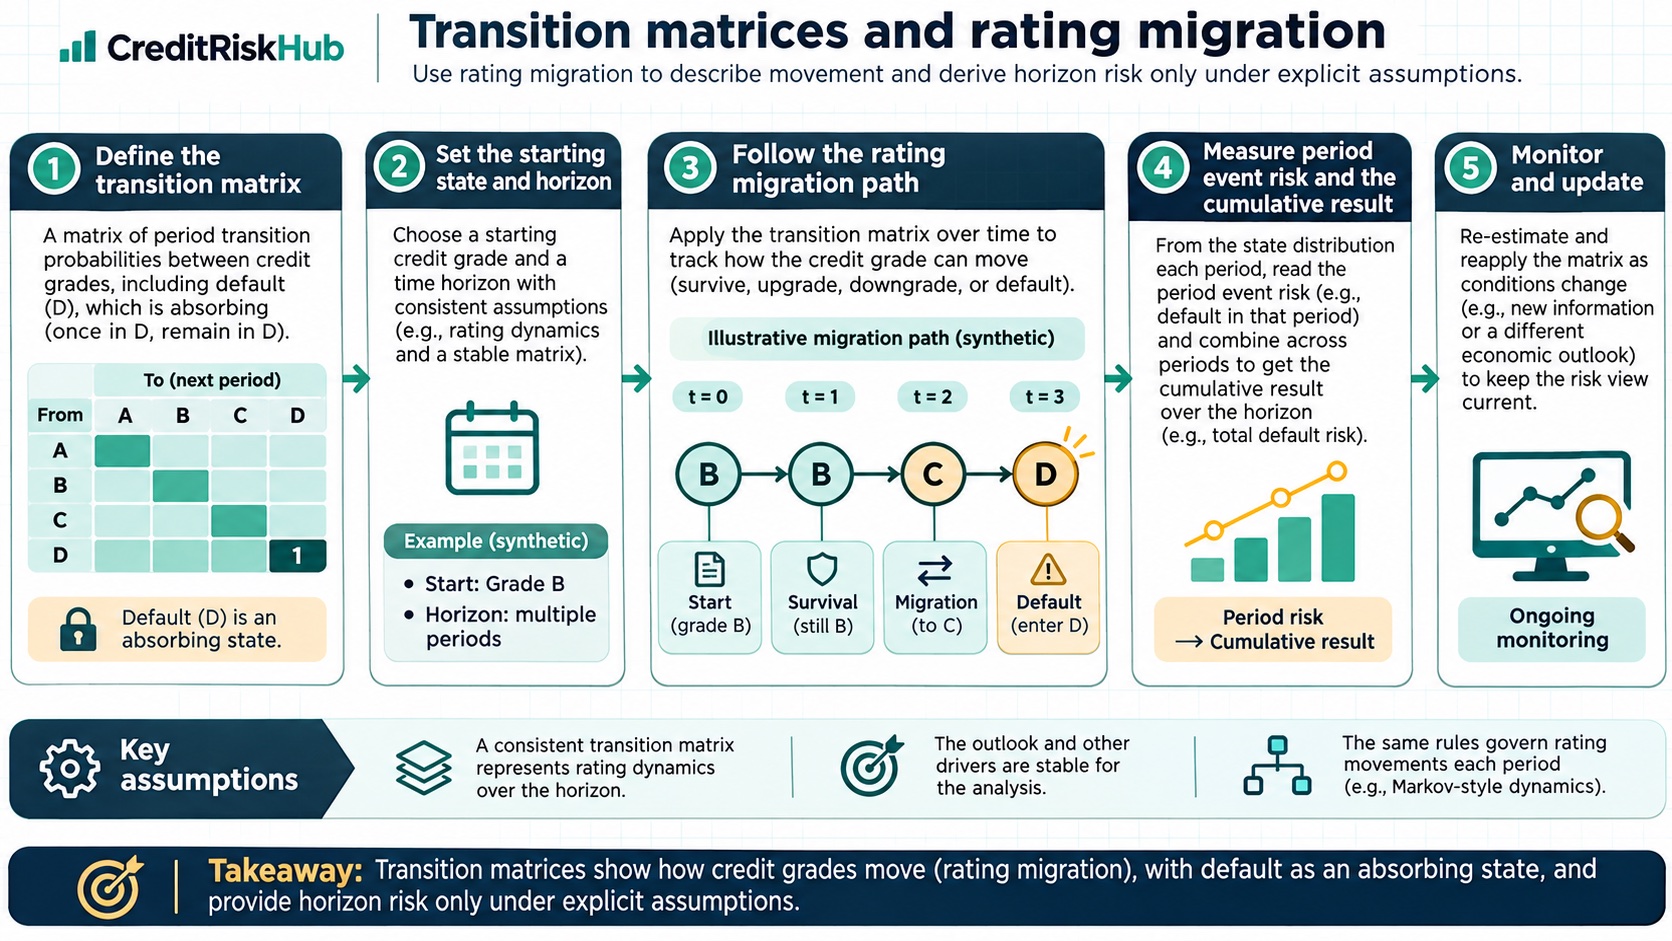
Show how transition matrices represent changes in credit grades, including default as an absorbing state.
Key terms
Hover over or focus a term for a quick definition, or open its glossary entry.
Key definitions
- A transition matrix contains probabilities of moving from each starting state to each ending state over an interval.
- An absorbing default state remains defaulted in later matrix steps for a standard cumulative-risk calculation.
n-step transition probabilities = Pⁿ; cumulative default probability from grade i is the default-state entry of Pⁿᵢ.Worked example
If a one-year matrix is estimated, a two-year matrix under a stationary Markov assumption is P×P; the two-year default probability is its default-column value.
Detailed explanation
A migration matrix counts movement between ordered rating grades and default states. It can summarize upgrades, downgrades, and stability, and under a Markov assumption matrix multiplication can project multi-period transitions. Keep default absorbing when the question is cumulative probability of having defaulted.
The projection is only as credible as its transition estimates and assumptions. Rating systems, portfolio composition, time interval, and treatment of withdrawn accounts should be stable or explicitly reconciled. A transition-derived PD is one methodology among several; compare it with direct cohort rates, calibration methods, and survival estimates. Report uncertainty and stress sensitivity rather than treating a historical matrix as a forecast guarantee.
Try a reproducible Python example
These examples use synthetic inputs and run locally in a browser worker. Edit the code, run it, and compare its output with the published example.
Runnable Python · local in your browser
Convert a logistic model logit to PD
Apply the logistic function to an illustrative intercept plus two feature contributions.
Output
Run the code to see the output.
Runtime loads only after you press Run. Code runs in a separate browser worker with a 10-second limit and a 20,000-character output cap. Use synthetic examples only; browser execution is not a secure environment for secrets or sensitive records.
Runnable Python · local in your browser
Calculate year-by-year marginal and cumulative PD
Follow years 1–3 separately: conditional PD is the rate among survivors, marginal PD is the share of the original cohort defaulting in that year, and cumulative PD adds those marginal shares.
Output
Run the code to see the output.
Runtime loads only after you press Run. Code runs in a separate browser worker with a 10-second limit and a 20,000-character output cap. Use synthetic examples only; browser execution is not a secure environment for secrets or sensitive records.
Assumptions
- Ratings are consistently defined, transitions use aligned intervals, and the cohort handling is specified.
Limitations
- Stationarity and Markov assumptions can fail during regime changes.
- Small cohorts create unstable transition estimates.
References
- Basel Framework: IRB approach and credit-risk components — Basel Committee on Banking Supervision
- Guidelines on PD estimation, LGD estimation and treatment of defaulted assets — European Banking Authority
Educational material only. Methods and examples are simplified; state and validate the assumptions required for your use case.