Validation and governance
PSI, CSI, and drift monitoring
Compare population and feature distributions while disclosing bins, smoothing, and threshold limitations.
Purpose
Explain population stability and characteristic stability indices as descriptive drift measures.
Key terms
Hover over or focus a term for a quick definition, or open its glossary entry.
Key definitions
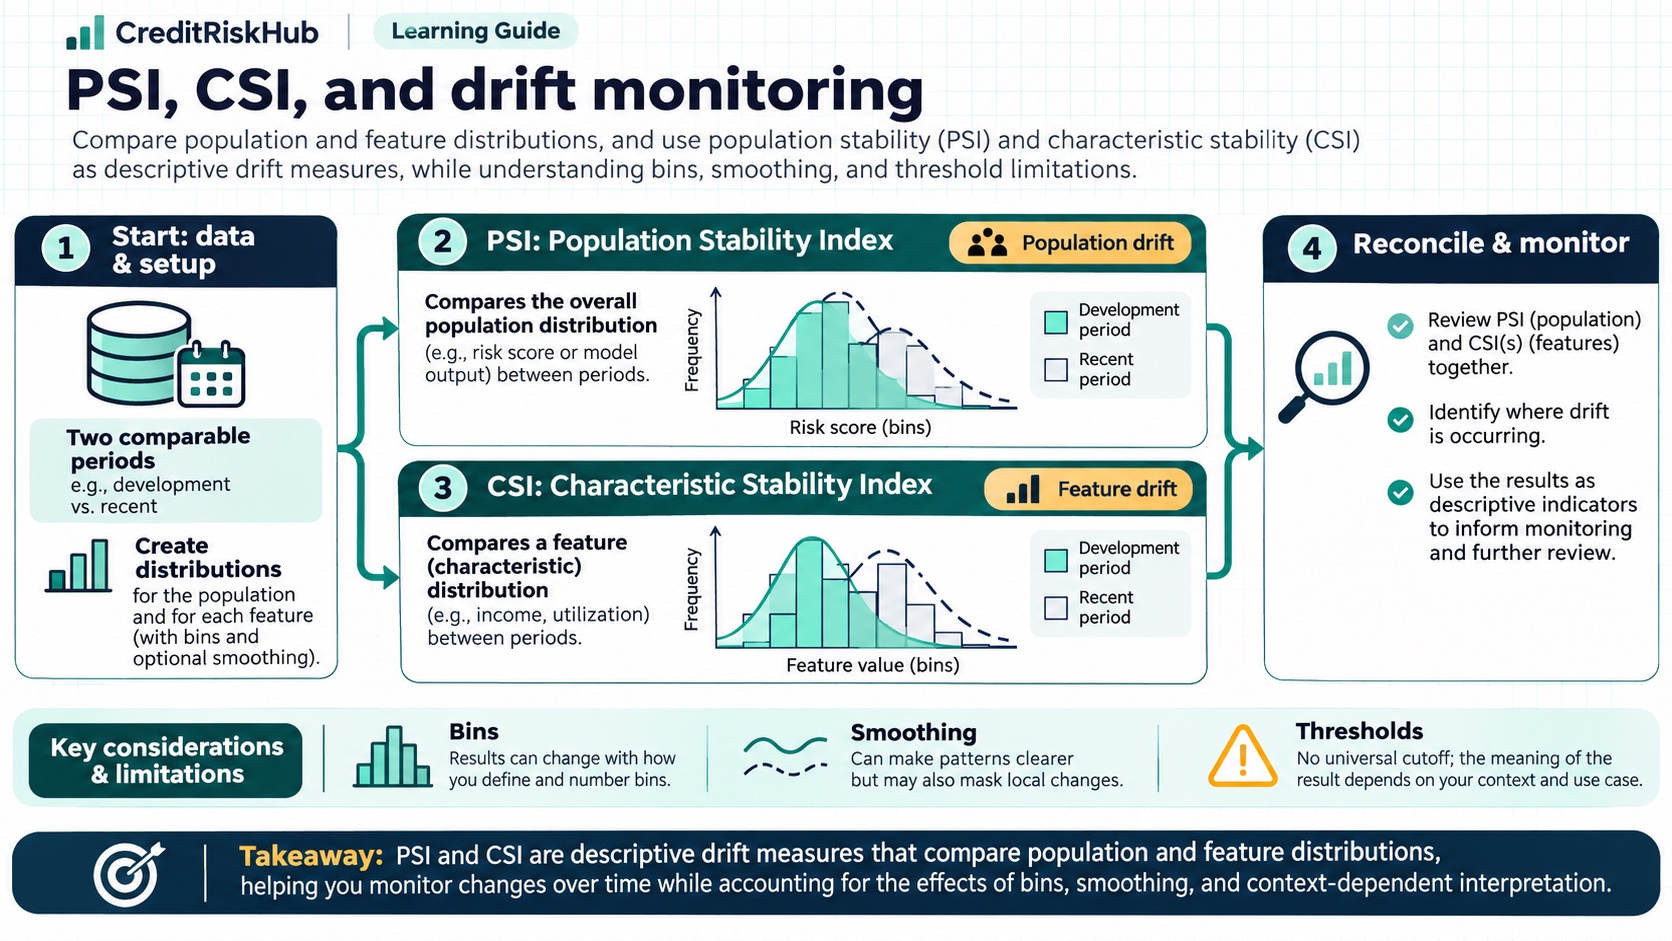
- Population Stability Index (PSI) compares distributions between a reference and comparison population.
- Characteristic Stability Index (CSI) applies a similar comparison to an individual feature.
Index = Σᵢ(current_shareᵢ − reference_shareᵢ) × ln(current_shareᵢ/reference_shareᵢ), with disclosed zero-share handling.Worked example
A bin's share changes from 20% to 25%; its contribution is (0.25−0.20)×ln(0.25/0.20), before summing all bins.
Detailed explanation
Stability indices compress distribution changes into one number, but results depend on the chosen bins and reference. Treat PSI/CSI as signals to investigate, not proof that predictive performance has deteriorated. Also monitor raw feature distributions, missingness, population mix, score distributions, and upstream pipeline quality.
Define reference windows that are relevant to the model and business cycle. Keep bins stable where possible, combine sparse categories thoughtfully, and show contributions so analysts can see which segments moved. Set thresholds from materiality, sample size, risk, and historical behavior for the specific portfolio; do not copy a universal threshold from an online rule of thumb.
Try a reproducible Python example
These examples use synthetic inputs and run locally in a browser worker. Edit the code, run it, and compare its output with the published example.
Runnable Python · local in your browser
Monitor observed-to-expected and Brier score
Compare a small set of matured binary outcomes against predicted PD values.
Output
Run the code to see the output.
Runtime loads only after you press Run. Code runs in a separate browser worker with a 10-second limit and a 20,000-character output cap. Use synthetic examples only; browser execution is not a secure environment for secrets or sensitive records.
Runnable Python · local in your browser
Calculate ROC-AUC, Gini, KS, precision, and recall
Use synthetic out-of-sample scores and matured labels. Higher scores indicate higher risk; the example computes pairwise ROC-AUC and a threshold-specific operating point.
Output
Run the code to see the output.
Runtime loads only after you press Run. Code runs in a separate browser worker with a 10-second limit and a 20,000-character output cap. Use synthetic examples only; browser execution is not a secure environment for secrets or sensitive records.
Assumptions
- Bins, reference period, missing-value treatment, and smoothing are fixed and documented.
Limitations
- Index values depend on binning and can be unstable for sparse categories.
- There are no universal alert thresholds suitable for every model and population.
References
- Guideline E-23: Model Risk Management — Office of the Superintendent of Financial Institutions Canada
- Metrics and scoring: quantifying the quality of predictions — scikit-learn documentation
Educational material only. Methods and examples are simplified; state and validate the assumptions required for your use case.