Validation and governance
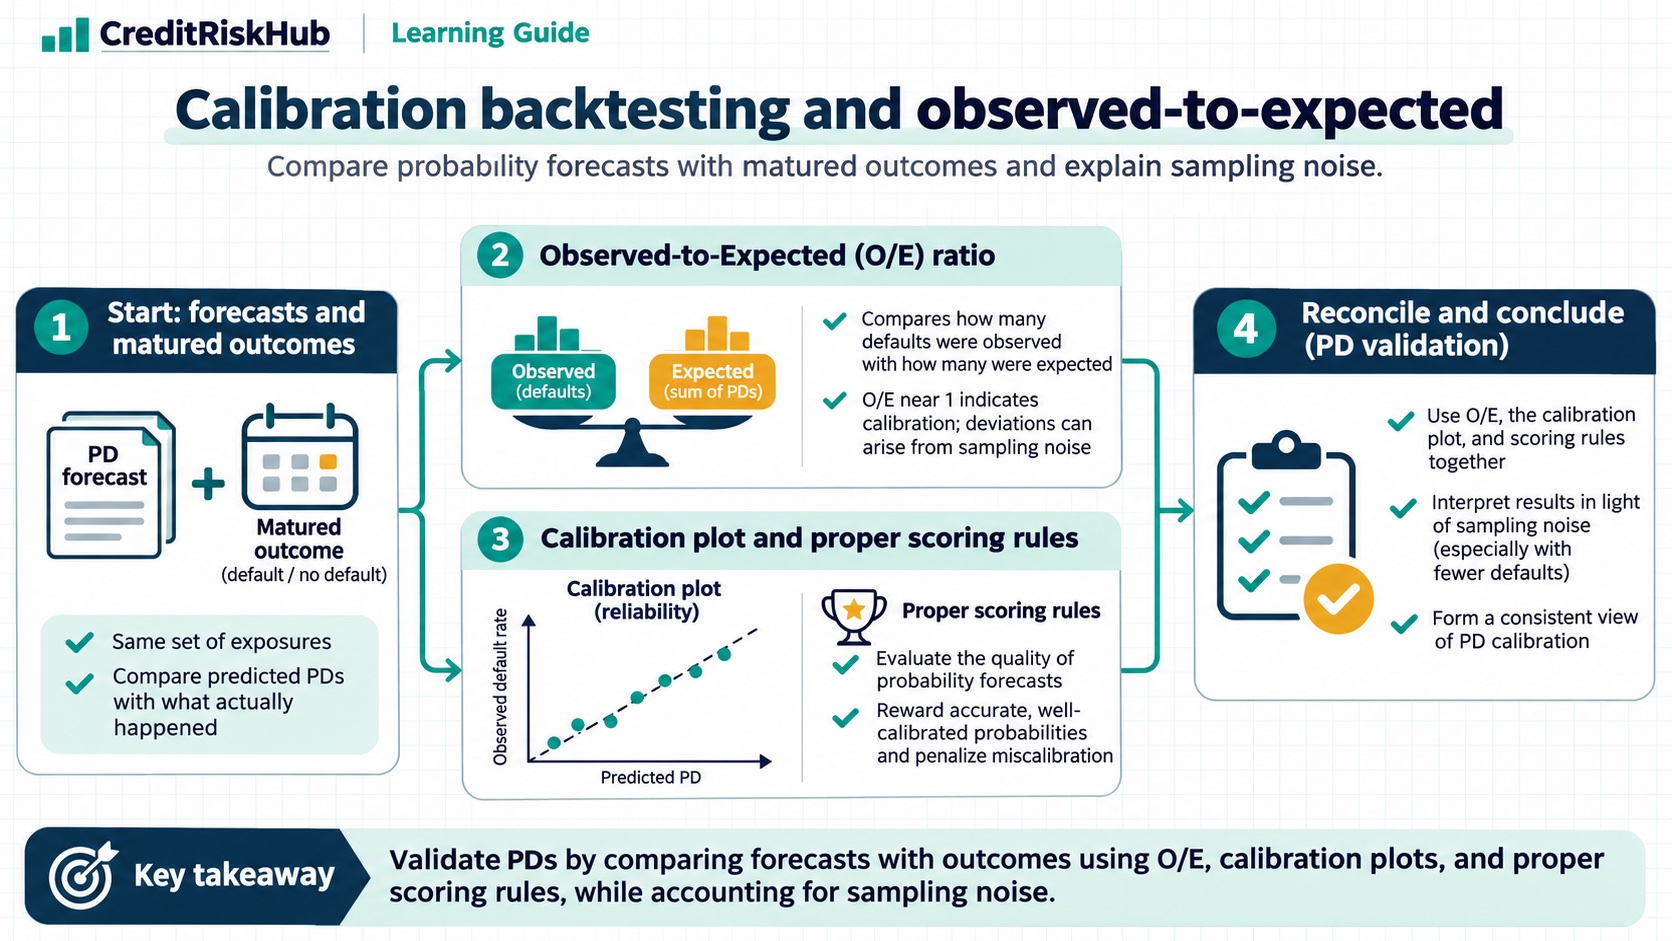
Calibration backtesting and observed-to-expected
Compare probability forecasts with matured outcomes and explain sampling noise.
Purpose
Set up observed-to-expected ratios, calibration plots, and proper scoring rules for PD validation.
Key terms
Hover over or focus a term for a quick definition, or open its glossary entry.
Key definitions
- Observed-to-expected (O/E) compares realized events with the sum of predicted probabilities for a matched set.
- A calibration curve compares observed frequencies with average predicted probabilities across bins.
O/E = observed defaults ÷ Σ predicted PD; O/E near 1 is consistent with aggregate calibration for that sample, within uncertainty.Worked example
If 24 defaults occur against 20 expected, O/E = 1.20; assess count variability and mix before concluding the model is biased.
Detailed explanation
Backtesting compares forecasts with outcomes after an appropriate observation period. O/E offers a compact aggregate check, while calibration curves show where under- or over-prediction occurs across risk bands. Calibration intercept and slope can diagnose systematic level and extremity differences when estimated on a suitable sample.
Use fully matured, out-of-sample forecasts and align population, horizon, censoring, and weights. Segment by time, product, score band, and risk group where event counts support interpretation. Brier score and log loss summarize probability error but combine multiple properties. A single O/E breach should trigger investigation, not automatic recalibration without data and governance review.
Try a reproducible Python example
These examples use synthetic inputs and run locally in a browser worker. Edit the code, run it, and compare its output with the published example.
Runnable Python · local in your browser
Monitor observed-to-expected and Brier score
Compare a small set of matured binary outcomes against predicted PD values.
Output
Run the code to see the output.
Runtime loads only after you press Run. Code runs in a separate browser worker with a 10-second limit and a 20,000-character output cap. Use synthetic examples only; browser execution is not a secure environment for secrets or sensitive records.
Runnable Python · local in your browser
Calculate ROC-AUC, Gini, KS, precision, and recall
Use synthetic out-of-sample scores and matured labels. Higher scores indicate higher risk; the example computes pairwise ROC-AUC and a threshold-specific operating point.
Output
Run the code to see the output.
Runtime loads only after you press Run. Code runs in a separate browser worker with a 10-second limit and a 20,000-character output cap. Use synthetic examples only; browser execution is not a secure environment for secrets or sensitive records.
Assumptions
- Predictions are out-of-sample and outcomes have matured under the same event definition and horizon.
Limitations
- Aggregate O/E can hide offsetting segment errors.
- Portfolio changes and macro conditions may explain movement without proving model failure.
References
- Probability calibration — scikit-learn documentation
- Metrics and scoring: quantifying the quality of predictions — scikit-learn documentation
Educational material only. Methods and examples are simplified; state and validate the assumptions required for your use case.