Statistics and machine learning
Logistic regression, trees, and boosting
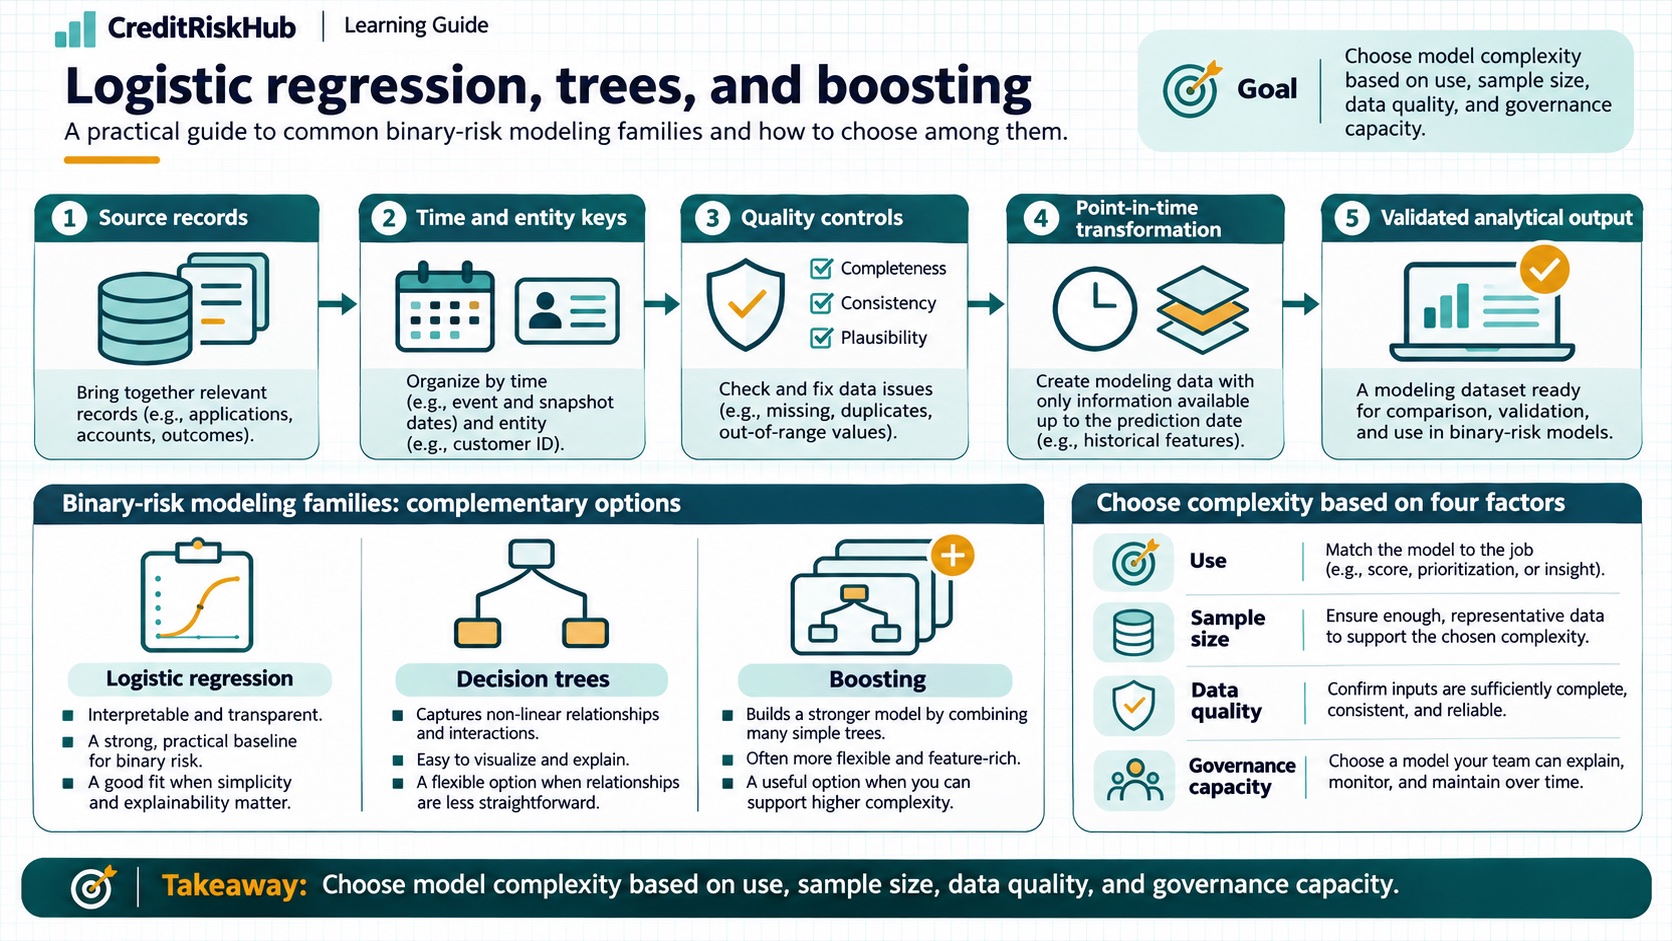
Choose model complexity based on use, sample size, data quality, and governance capacity.
Purpose
Compare common binary-risk modeling families without treating complexity as performance by itself.
Key terms
Hover over or focus a term for a quick definition, or open its glossary entry.
Key definitions
- Logistic regression models log-odds as a linear predictor.
- Decision trees partition feature space; ensembles combine many trees to improve predictive fit.
Binary logistic model: logit(PD) = β₀ + βᵀx; tree models estimate risk in learned regions or ensembles.Worked example
Compare candidate models using out-of-time discrimination, calibration, stability, explanation burden, and operating constraints—not training accuracy alone.
Detailed explanation
Start from a baseline the team can explain. Logistic regression offers coefficient-based structure and can be a strong choice where relationships are reasonably captured by transformed features. Trees and boosting can capture interactions and nonlinearities but may be more sensitive to tuning, data drift, and implementation details.
Benchmark candidates on identical time-based splits and compare discrimination and probability calibration separately. Check whether gains persist across products and risk groups, whether explanations support the decision, and whether inputs are available reliably. Model selection is a governance decision as well as a statistical one; choose a method the institution can validate, monitor, and maintain.
Try a reproducible Python example
These examples use synthetic inputs and run locally in a browser worker. Edit the code, run it, and compare its output with the published example.
Runnable Python · local in your browser
Calculate WOE and IV from grouped counts
Use synthetic good and bad counts for three ordered scorecard bins. The 0.5 adjustment avoids a zero distribution in this small example.
Output
Run the code to see the output.
Runtime loads only after you press Run. Code runs in a separate browser worker with a 10-second limit and a 20,000-character output cap. Use synthetic examples only; browser execution is not a secure environment for secrets or sensitive records.
Runnable Python · local in your browser
Convert a logistic model logit to PD
Apply the logistic function to an illustrative intercept plus two feature contributions.
Output
Run the code to see the output.
Runtime loads only after you press Run. Code runs in a separate browser worker with a 10-second limit and a 20,000-character output cap. Use synthetic examples only; browser execution is not a secure environment for secrets or sensitive records.
Assumptions
- Comparisons use the same target definition, validation period, features, and calibration assessment.
Limitations
- Nonlinear models can be unstable or hard to explain for a given use.
- A more flexible model may need additional calibration and governance.
References
- Metrics and scoring: quantifying the quality of predictions — scikit-learn documentation
- Guideline E-23: Model Risk Management — Office of the Superintendent of Financial Institutions Canada
Educational material only. Methods and examples are simplified; state and validate the assumptions required for your use case.